
Analysis
Analysis
In our research we tested nine different notes, (A3, C4, F4, G4, B4, E5, G5, C6, E6), so that we could get data for a few notes in every register that the clarinet can play. The data was collected as velocity, instead of pressure. The hot-wire doesn't give direction of flow, so all data found was its absolute value. Through integration of the velocity data, we obtained the position data, which is essentially pressure data. Due to restrictions with our setup, the actual values of the amplitude are voltages that describe velocities, and thusly pressure after integration. With a proper setup, these voltages could easily have been converted to velocities. This isn't to say that our data is incomplete, though. The data is still correct and shows trends and whats happening in the clarinet bore, but the numbers associated with it would need to be scaled to show the real values.
The hot-wire picks up the velocities inside of the bore and, via LabVIEW, the computer displays the waveform of the graph as well as the power spectrum. The waveform is to ensure that the signal is strong and the sound's amplitude isn't changing. This is important to make sure the sound is steady for testing. The power spectrum is more important. What the power spectrum does is display the different amplitudes of all the frequencies that make up a sound. This includes the harmonics. As can be seen in the graph below, the harmonics have a much higher amplitude than the noise surrounding it.
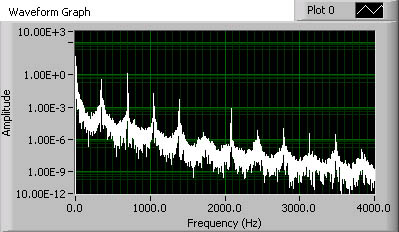
Power Spectrum of G4
The power spectrum is then processed so that the noise is eliminated and only the harmonics remain. This is so that the important data is easier to view and allows the computer to perform operations with it. This can be seen in the graph below. The bars that make up the harmonics show the amplitude of the peak at that frequency as well as the amplitude of the area around it. This extra ammount is 20 percent of the fundamental's frequency on both sides of the harmonic. So with a fundamental of 100 Hz, the second harmonic bar, say, would show the amplitudes of 180-220 Hz added up. The reason for the additional ammount is to deal with slightly out of tune notes or harmonics and because it more accuratly describes whats happening. Since the noise next to a harmonic is many powers of magnitude less than the harmonic itself, it doesn't yield inaccurate results.
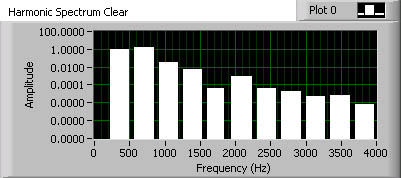
Power Spectrum of G4 is bar form
A power spectrum was taken every quarter inch down the bore of the clarinet from the middle of the mouth piece to a few inches past the first fully open tone hole for that note. This means the modified power spectrum with bars was done for each quarter inch as well. From here we seperated the individual harmonics and plotted their amplitude with relation to their position in the clarinet. With these plots it is possible to see where the relationship between harmonic's amplitudes changes.
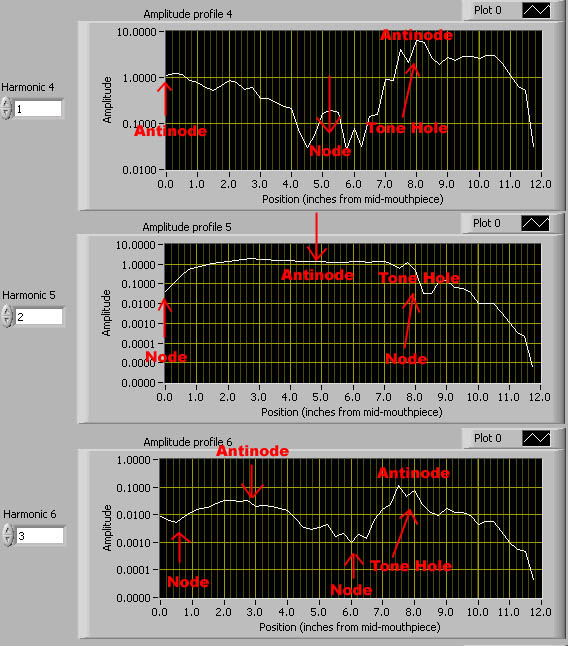
Amplitude Profiles of the first three harmonics for G4
On the plots above the position of the first open tone hole is marked, as well as the nodes and antinodes. After the tone hole it is apparent that all of the velocities drop off to nothing with all harmonics. This is why we're not examining what happens after these points. Before the tone hole, some very interesting things should be noted. The odd harmonics mostly start on an antinode and end on an antinode. The evens are the opposite. Once you head into the mid to upper harmonics this falls apart, but it remains important. The low harmonics have more energy and are therefore going to be less prone to external forces effecting them. This is why looking at the lower harmonics can represent the entire clarinet in an ideal situation. Also, some notes in the upper register have multiple open tone holes with closed ones after them. This affects the internal harmonics, and actually affects the external as well.
To see the first six harmonics plotted out for all of the notes, click below: